
Monitoring & Maps
Monitoring Overview
Students from schools in the Colgan Creek watershed will be learning about water quality monitoring by measuring temperature, dissolved oxygen, pH, turbidity, conductivity, nitrates and phosphates. Results will be uploaded to web pages for sharing with the public.
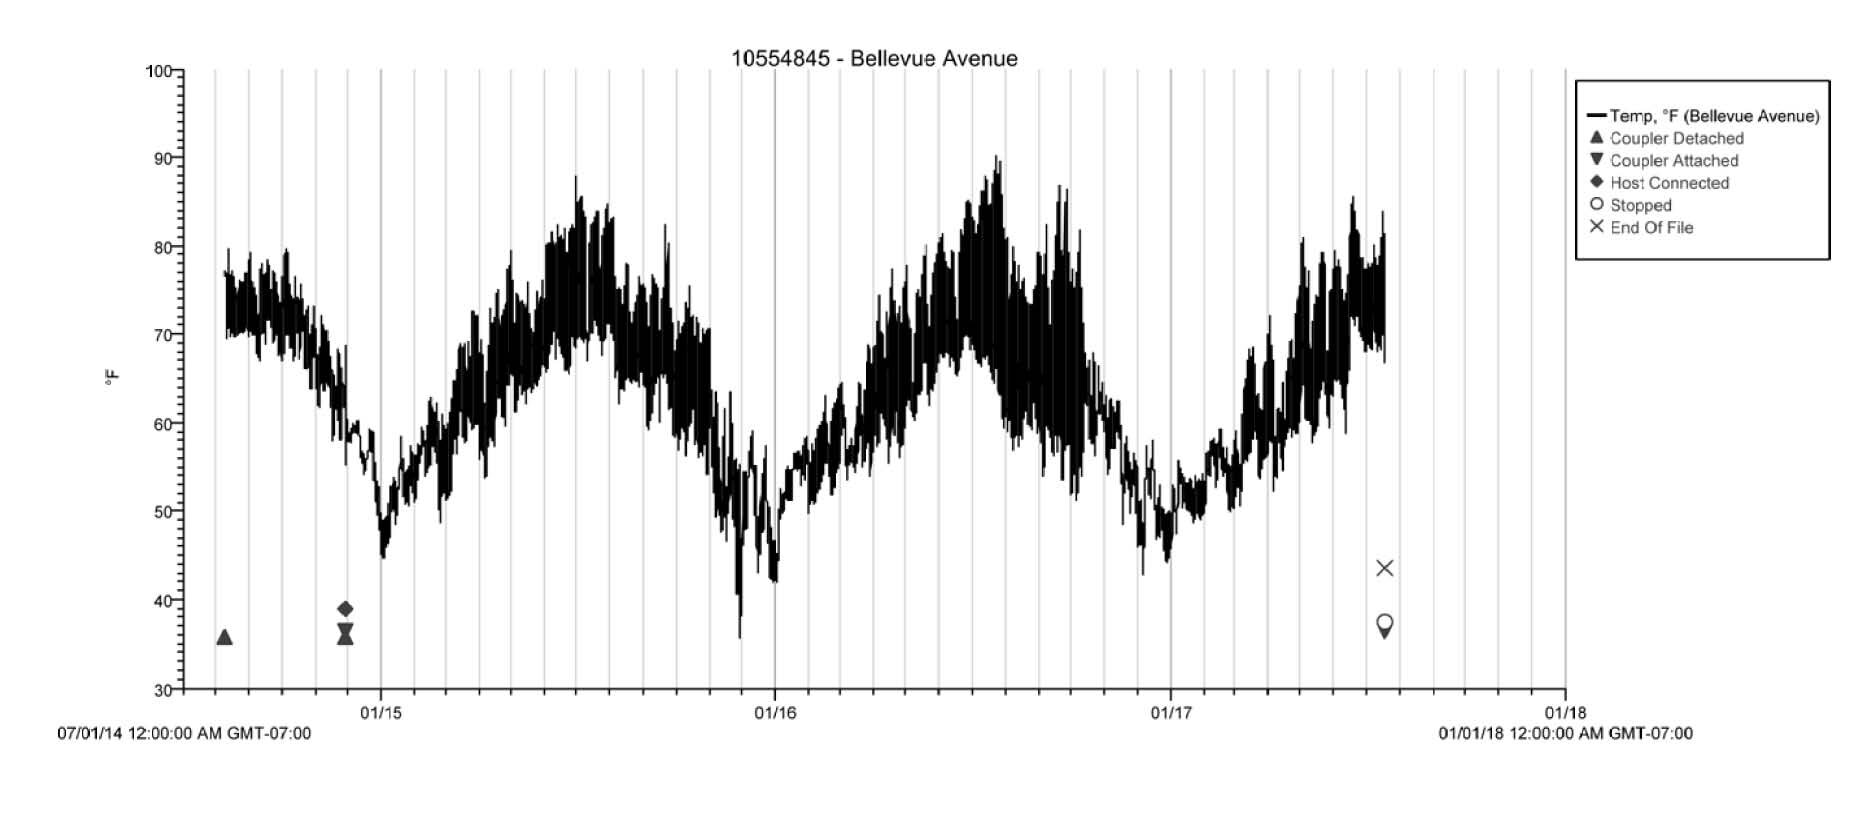
This graph shows temperatures recorded in Colgan Creek near Bellevue Avenue, at the downstream end of the Phase 1 restoration reach. The temperature data are for a two and a half year period and were recorded with an in-stream Hobo Tidbit. For more information about using Hobo temperature monitors, refer to the Trout Unlimited guidebook, Stream Temperature Monitoring.
How to Enter Data
To enter data, first download the data input form. Use this form to organize the data you collect at the stream. When you are ready to submit the data online, fill in the values for each parameter you tested on this page and click Submit for Review.
Your information will be reviewed and added to the database. You can see the data by going to the Interactive Map, and clicking the Water Quality Test Data link below the name of your monitoring station. Or click the monitoring station icon on the map.
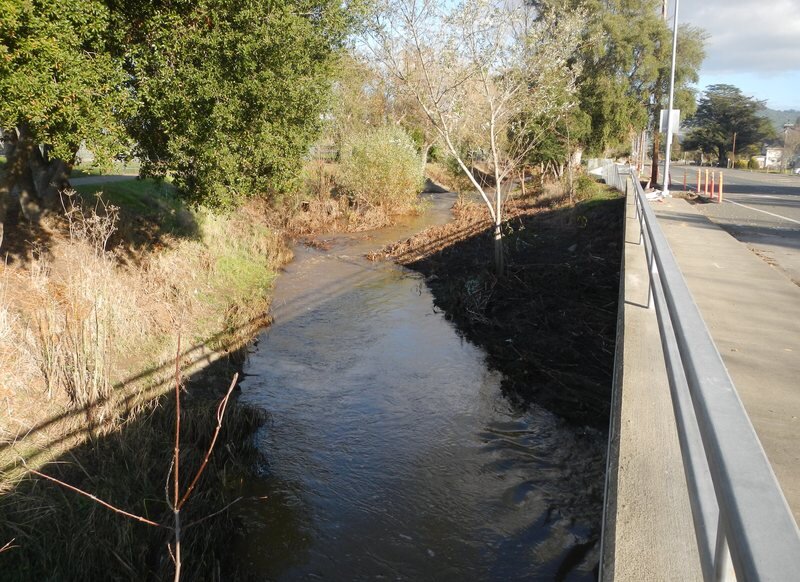
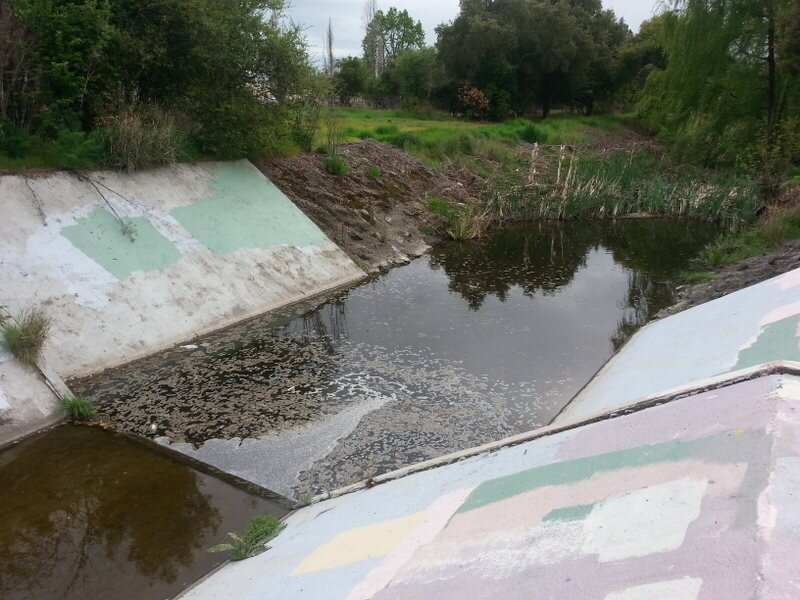
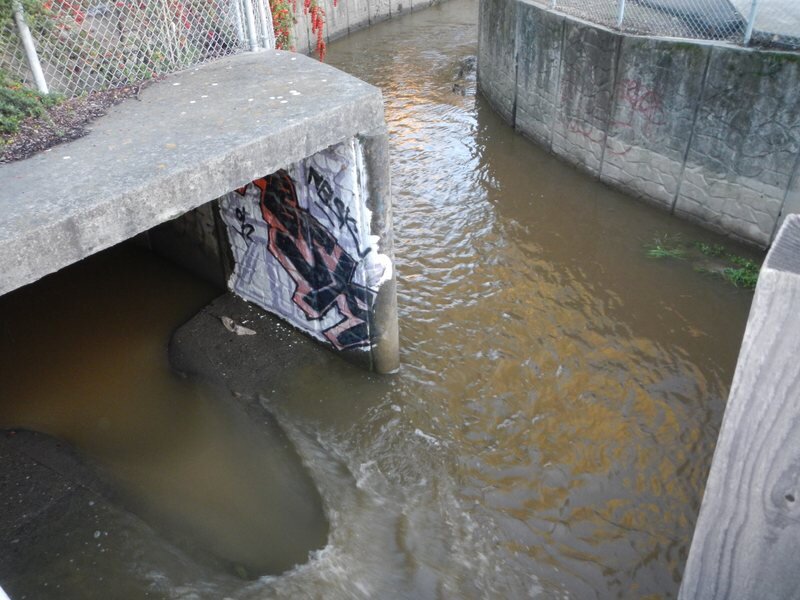
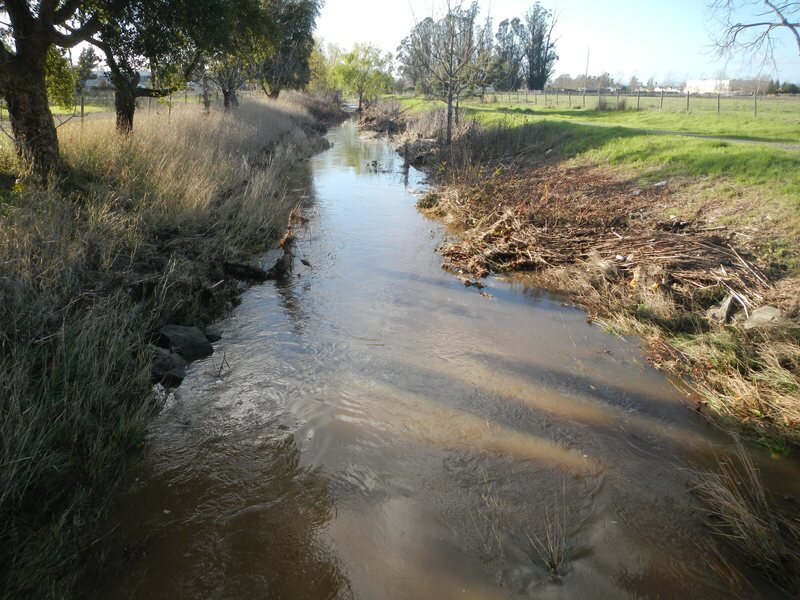
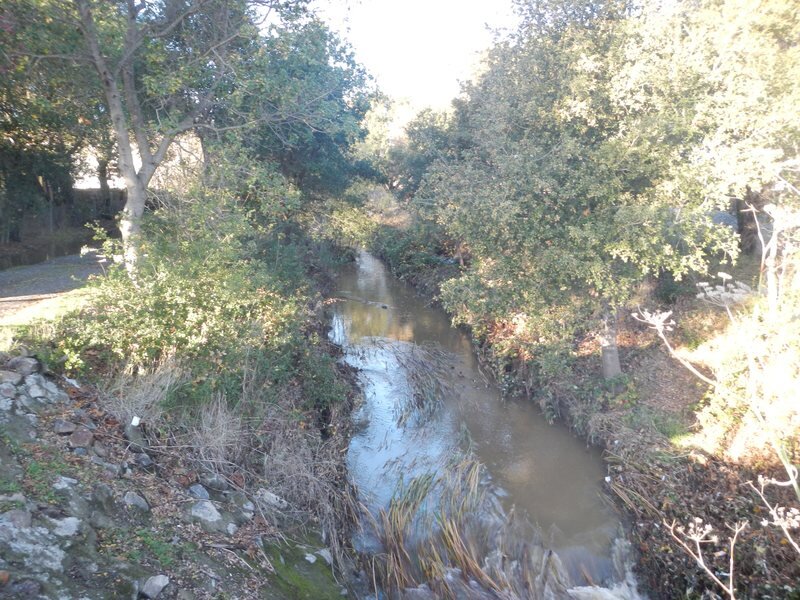
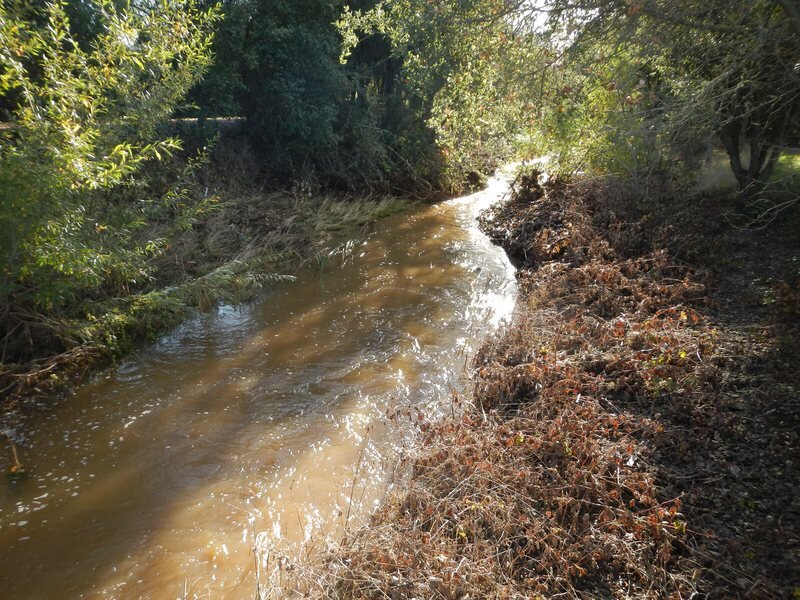
Photo Gallery of Monitoring Sites
Interactive Map
You can access the water quality data from the Map page. Or follow these links.
Kawana Terrace
Petaluma Hill Road
Kawana Springs Creek Confluence
Colgan Avenue Box Culvert
Hearn Avenue
Victoria Drive
Dutton Meadow
Bellevue Avenue
Watershed Maps
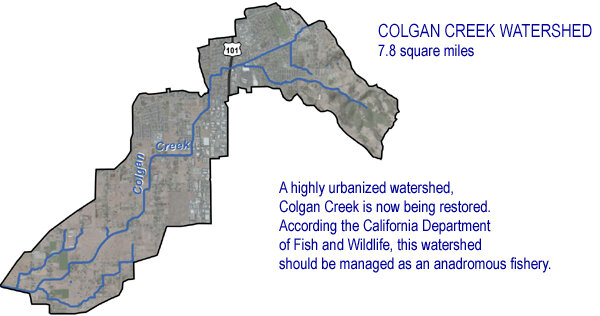
Colgan Creek Watershed Map
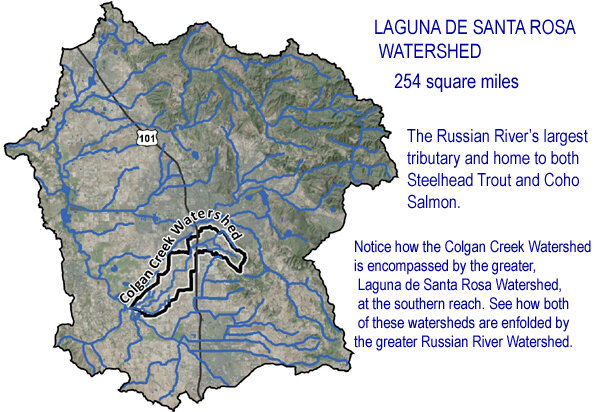
Laguna de Santa Rosa Watershed Map
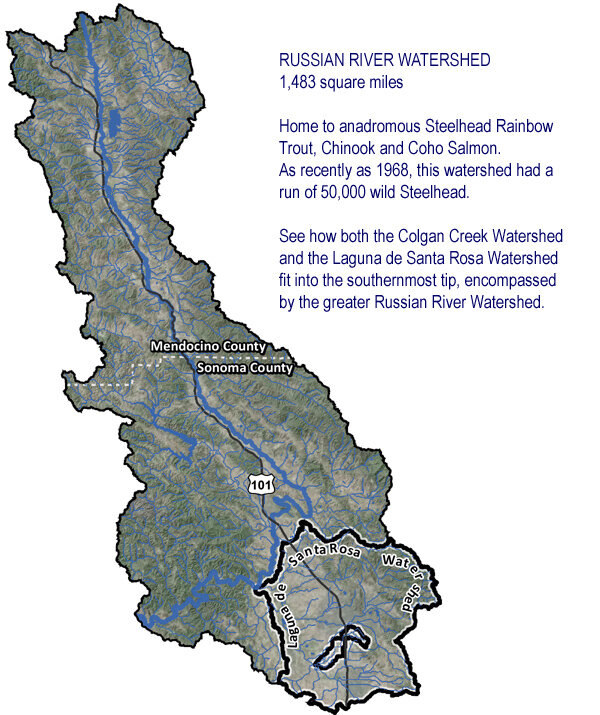
Russian River Watershed Map